

Signal-to-noise often is used to help determine the limit of detection (LOD) or limit of quantification (LOQ) of an HPLC method. To make this measurement, you’ll need to have a chromatogram under the desired conditions that contains enough baseline to measure the noise accurately – often 3-20 times the width of the peak.
The LOD is the minimum sample concentration at which the substance signal can be reliably detected when compared to the baseline noise of a blank run. A signal-to-noise between 2:1 and 3:1 is generally considered acceptable for estimating the limit of detection (LOD).
The LOQ is the minimum sample concentration at which the substance signal can be reliably quantified when compared to the baseline noise of a blank run. A signal-to-noise ratio is 10:1 is good for limit of quantification (LOQ).
Most of the analysts calculate signal to noise just following the below equation –
Signal to noise = S/N; where S = Signal, N = Noise.
But as per USP, the signal-to-noise ratio is calculated using the following equation:
S/N = 2H/h
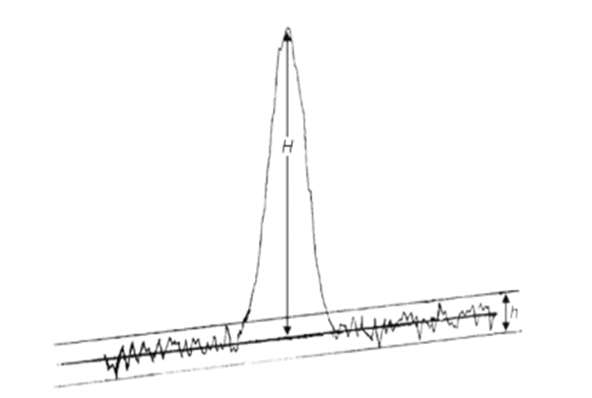
Where,
H = height of the peak corresponding to the component concerned, in the chromatogram obtained with the prescribed reference solution, measured from the maximum of the peak to the extrapolated baseline of the signal observed over a distance equal to 20 times the width at half-height.
h = range of the noise in a chromatogram obtained after injection of a blank, observed over a distance equal to 20 times the width at half-height of the peak in the chromatogram obtained with the prescribed reference solution and, if possible, situated equally around the place where this peak would be found.
As per EP, S/N is calculated as follows:
S/N = 2H/λ

Where,
H = Height of the peak corresponding to the component concerned, in the chromatogram obtained with the prescribed reference solution, measured from the maximum of the peak to the extrapolated baseline of the signal observed over a distance equal to 20 times the width at half-height.
λ = Range of the background noise in a chromatogram obtained after injection or application of a blank, observed over a distance equal to 20 times the width at half-height of the peak in the chromatogram obtained with the prescribed reference solution and, if possible, situated equally around the place where this peak would be found.
In Empower 2 software, the EP Signal-to-Noise (EP S/N) is determined in an automated fashion and does not require a blank injection. The intention of this calculation is to preserve the sense of the EP calculation without requiring a separate blank injection. The use of a blank injection does not allow for this calculation to be determined automatically.
The formula is as follows:

Read also: Peak to Vally Ratio Calculation
Post a Comment