

A simple model independent approach uses a difference factor (f1) and a similarity factor (f2) to compare dissolution profiles. The difference factor (f1) calculates the percent (%) difference between the two curves at each time point and is a measurement of the relative error between the two curves:

The similarity factor (f2) is a logarithmic reciprocal square root transformation of the sum of squared error and is a measurement of the similarity in the percent (%) dissolution between the two curves.

Note:
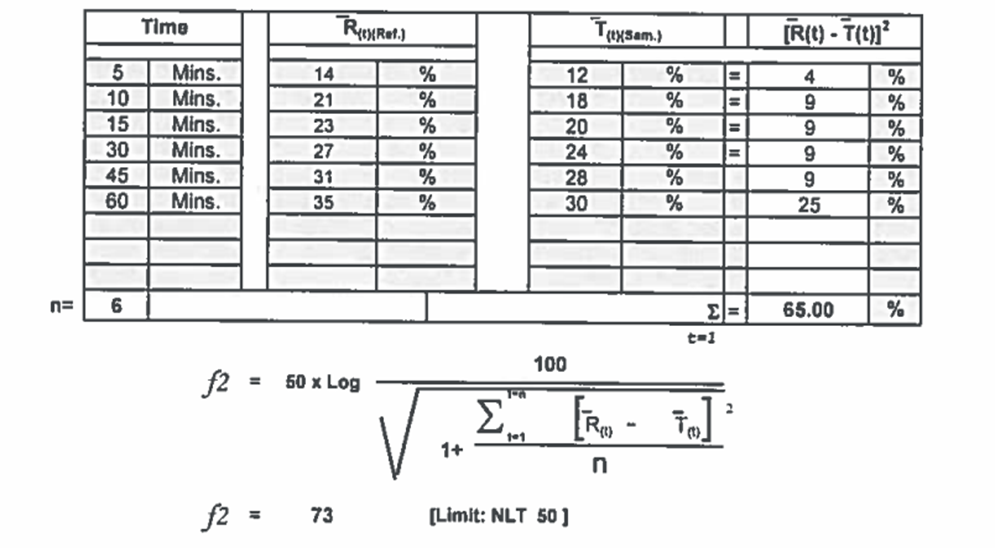
1. Determine the dissolution profile of two products (12 units each) of the test (postchange) and reference (prechange) products.
2. Using the mean dissolution values from both curves at each time interval, calculate the difference factor (f1) and similarity factor (f2) using the above equations.
3. For curves to be considered similar, f values should be close to 0, and f 1 2 values should be close to 100. Generally, f values up to 15 (0-15) and f values 1 2 greater than 50 (50-100) ensure sameness or equivalence of the two curves and, thus, of the performance of the test (postchange) and reference (prechange) products.
Dissolution f2 Calculation Excel Sheet
In recent years, FDA has placed more emphasis on a dissolution profile comparison in the area of post-approval changes and biowaivers. Under appropriate test conditions, a dissolution profile can characterize the product more precisely than a single point dissolution test.
A dissolution profile comparison between pre-change and post-change products for SUPAC related changes, or with different strengths, helps assure similarity in product performance.
As per USP,
For products that dissolve very rapidly (≥85% dissolution in 15 min), a profile comparison is not necessary (thus, f2 calculation is not required).
Read also:
إرسال تعليق